Local token & cost dashboard for AI coding tools


















Try it without installing → tokdash.github.io/demo
[!NOTE]
Day 1 support for DeepSeek Harness. Tokens, cost and sessions are read locally from~/.dsh, with nothing to configure. Supported clients →
[!TIP]
Tokdash Companion Status Bar App for macOS and Windows is now available as an unsigned preview. See today's spend and subscription quota without keeping the dashboard open. View screenshots, download, and set it up →
Performance: about 30× faster than pre-0.6.0 cold usage scans, and 15× faster than ccusage in the same local benchmark.
Table of Contents
- Features
- Supported clients
- Tokdash Companion Status Bar App
- Quick start
- Configuration
- Privacy & security
- API (local)
- Cost Accuracy Note
- History retention
- Roadmap
- Contributing / security
- Documentation
- Project structure
- License
Features
- Exact token counts: Input/Output/Cache token breakdowns
- Statusline integration [new]: drop a live token-usage indicator into Claude Code's statusline (or any agent that can hit a local HTTP endpoint) — see Statusline integration
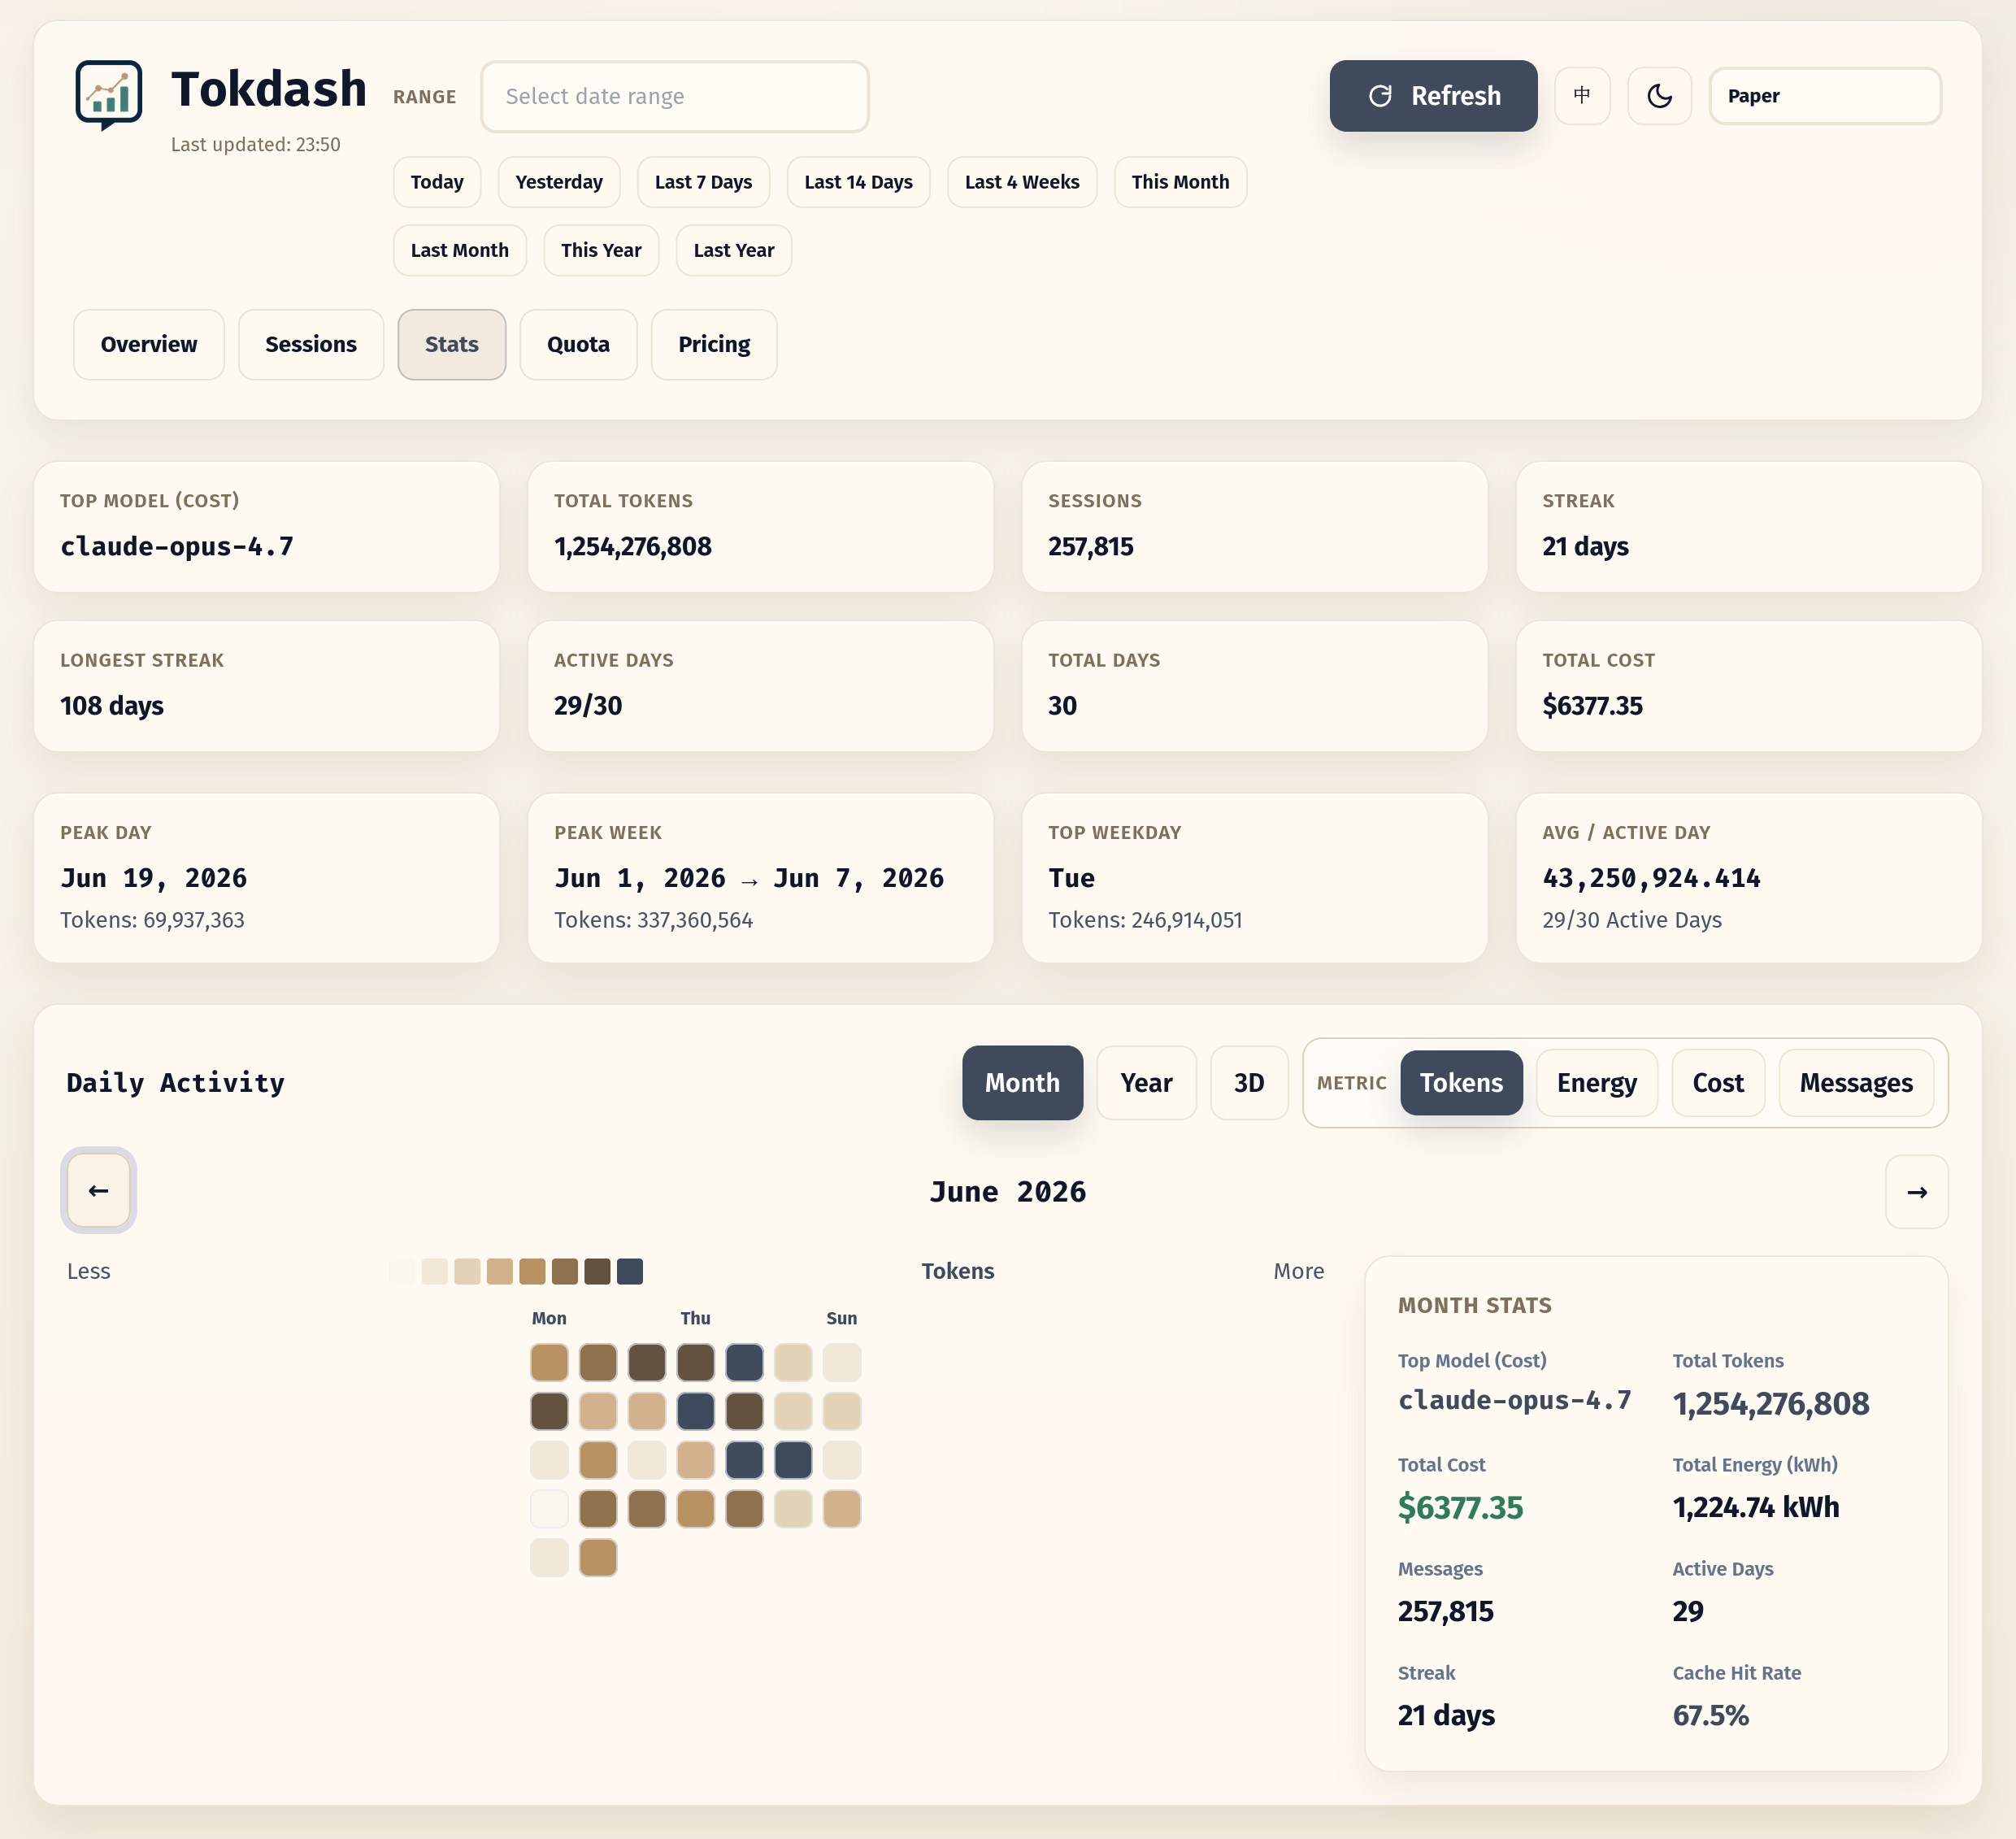
- Contribution calendar: 2D heatmap + 3D isometric view with Tokens/Cost/Messages metrics
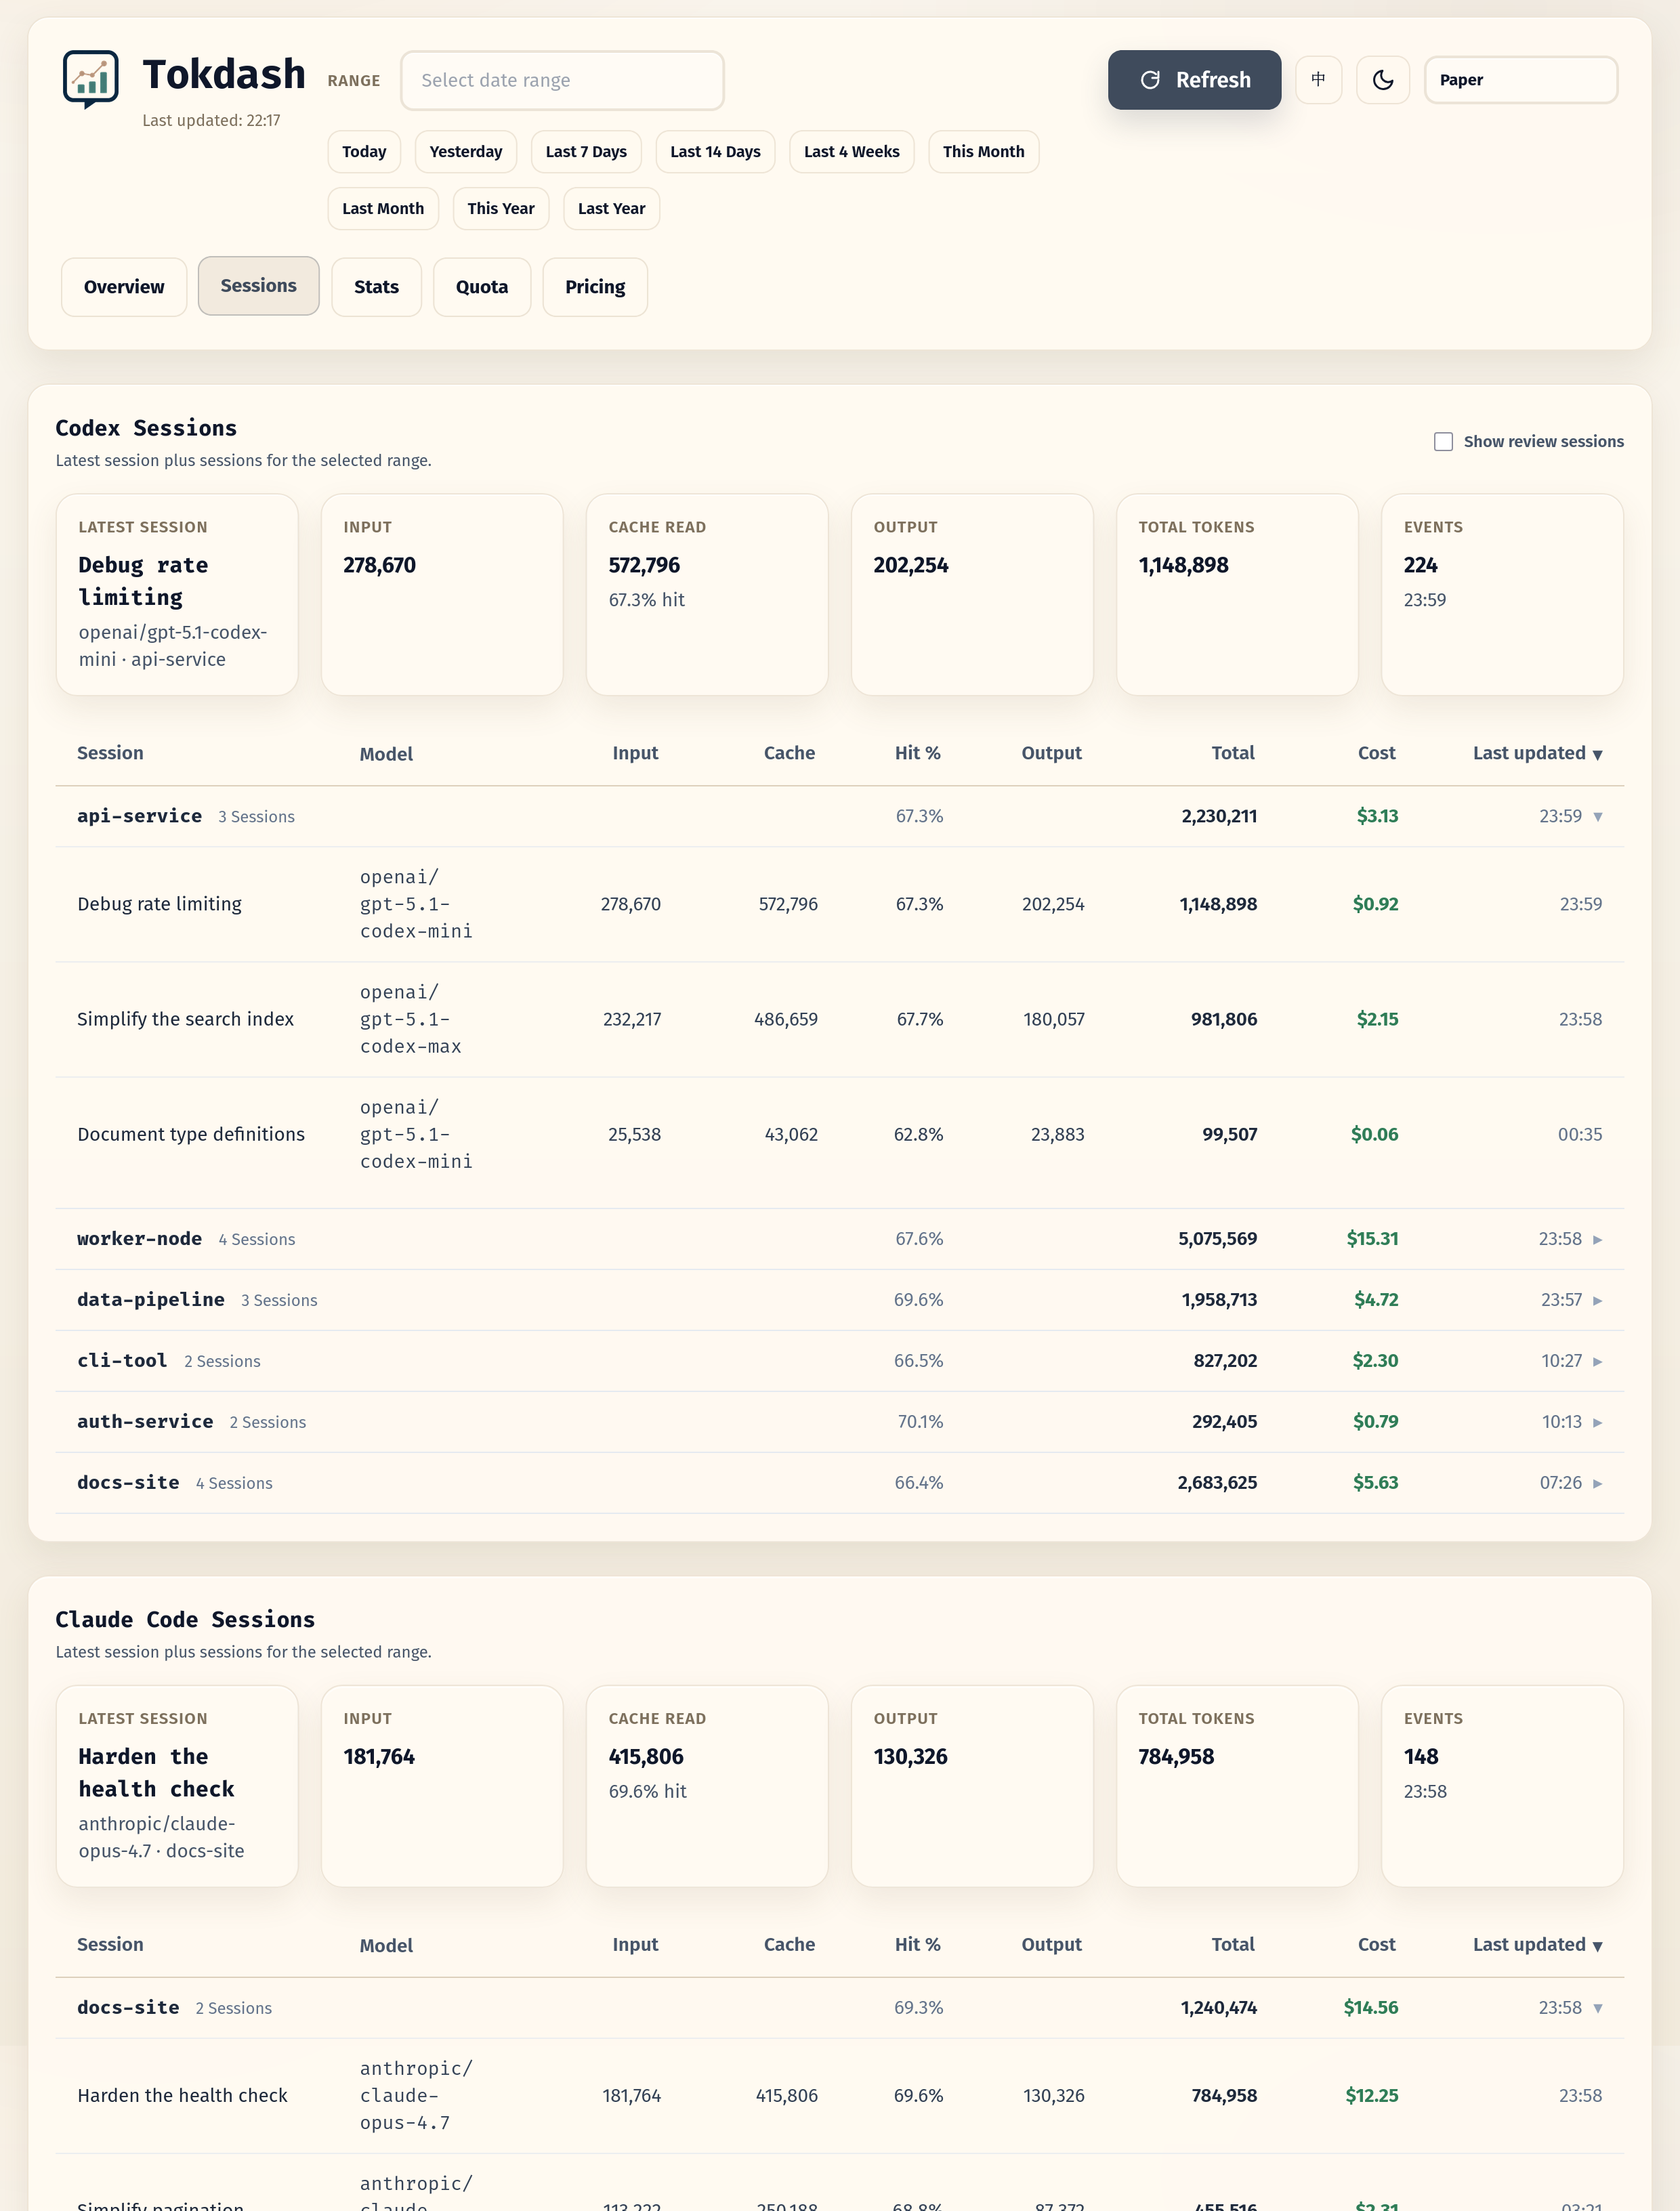
- Session explorer: per-session drill-down
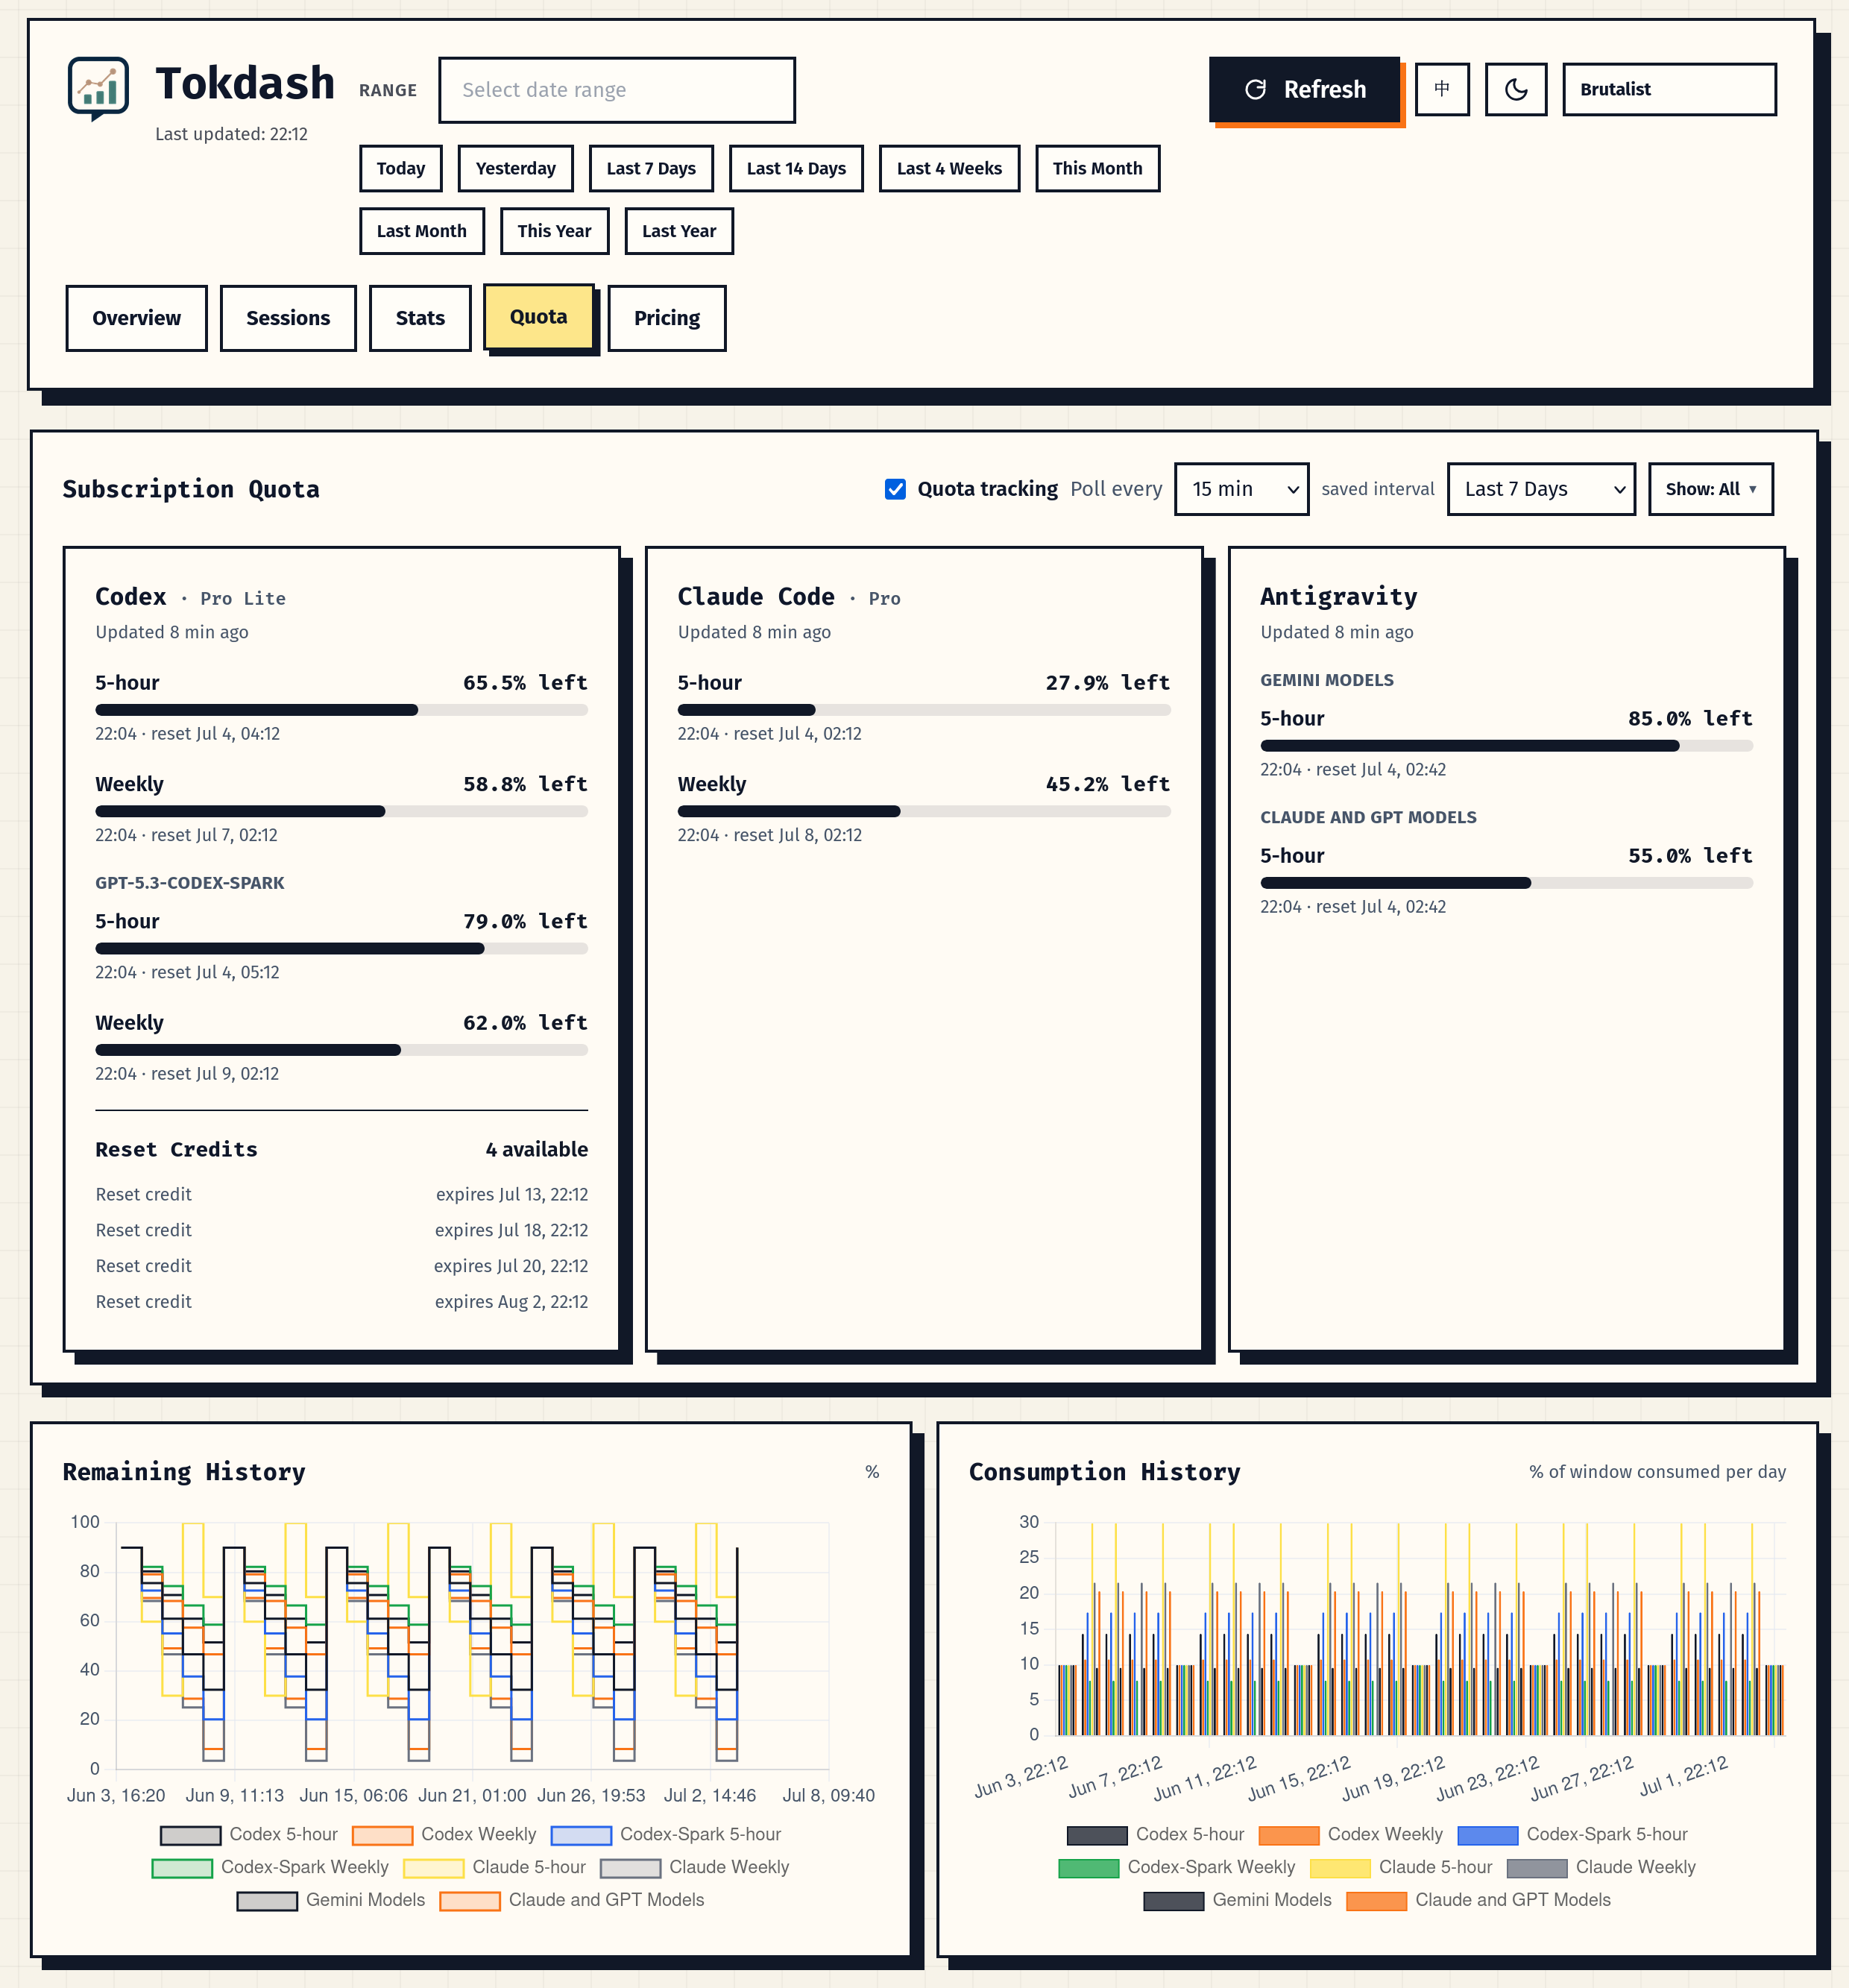
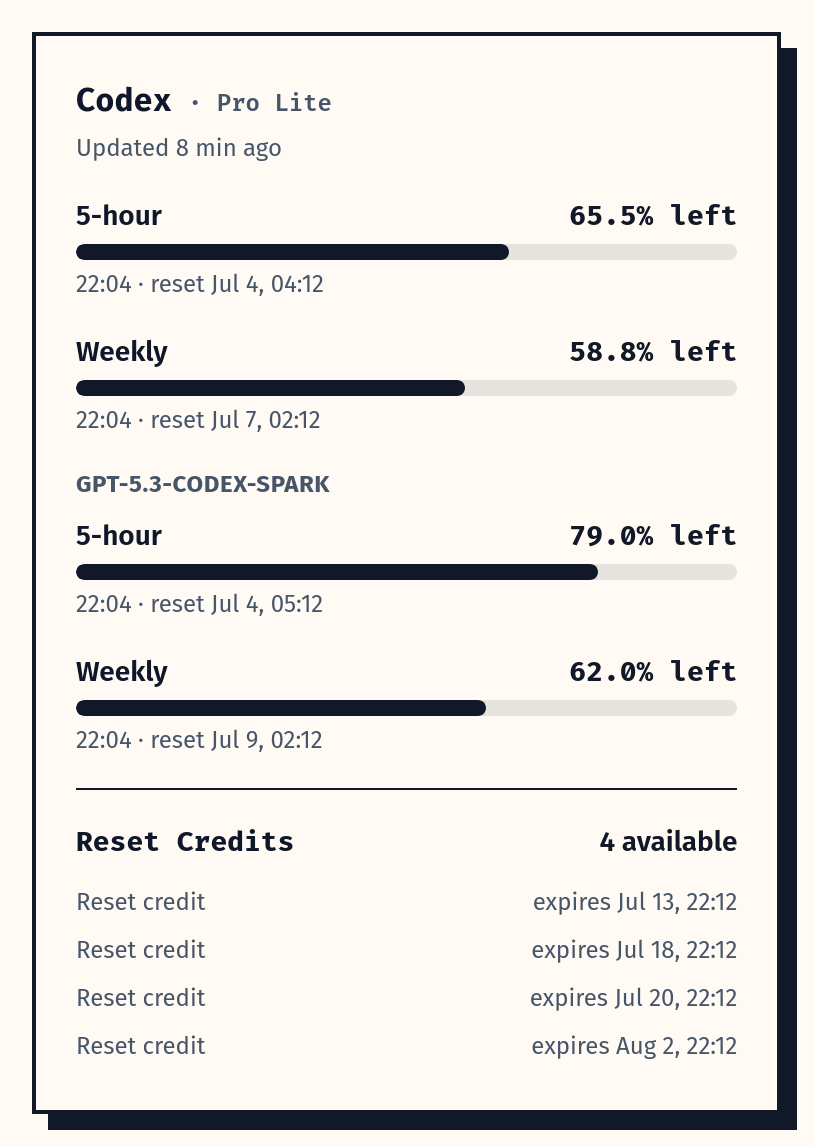
- Quota tab [new]: subscription window bars with reset countdowns for Codex, Claude Code, and Antigravity. Codex windows work out of the box from local logs; Codex reset credits, metered features, and all Claude/Antigravity quota need opt-in live polling
- Companion Status Bar App [new]: view spend and subscription quota from the macOS menu bar or Windows notification area — screenshots and downloads
- Multi-server views: add WSL, macOS, and other Tokdash servers in Settings; combine usage across any selection while keeping quota grouped by machine. See remote access.
- Themes and app polish: 10 style themes, light/dark mode, and PWA install support
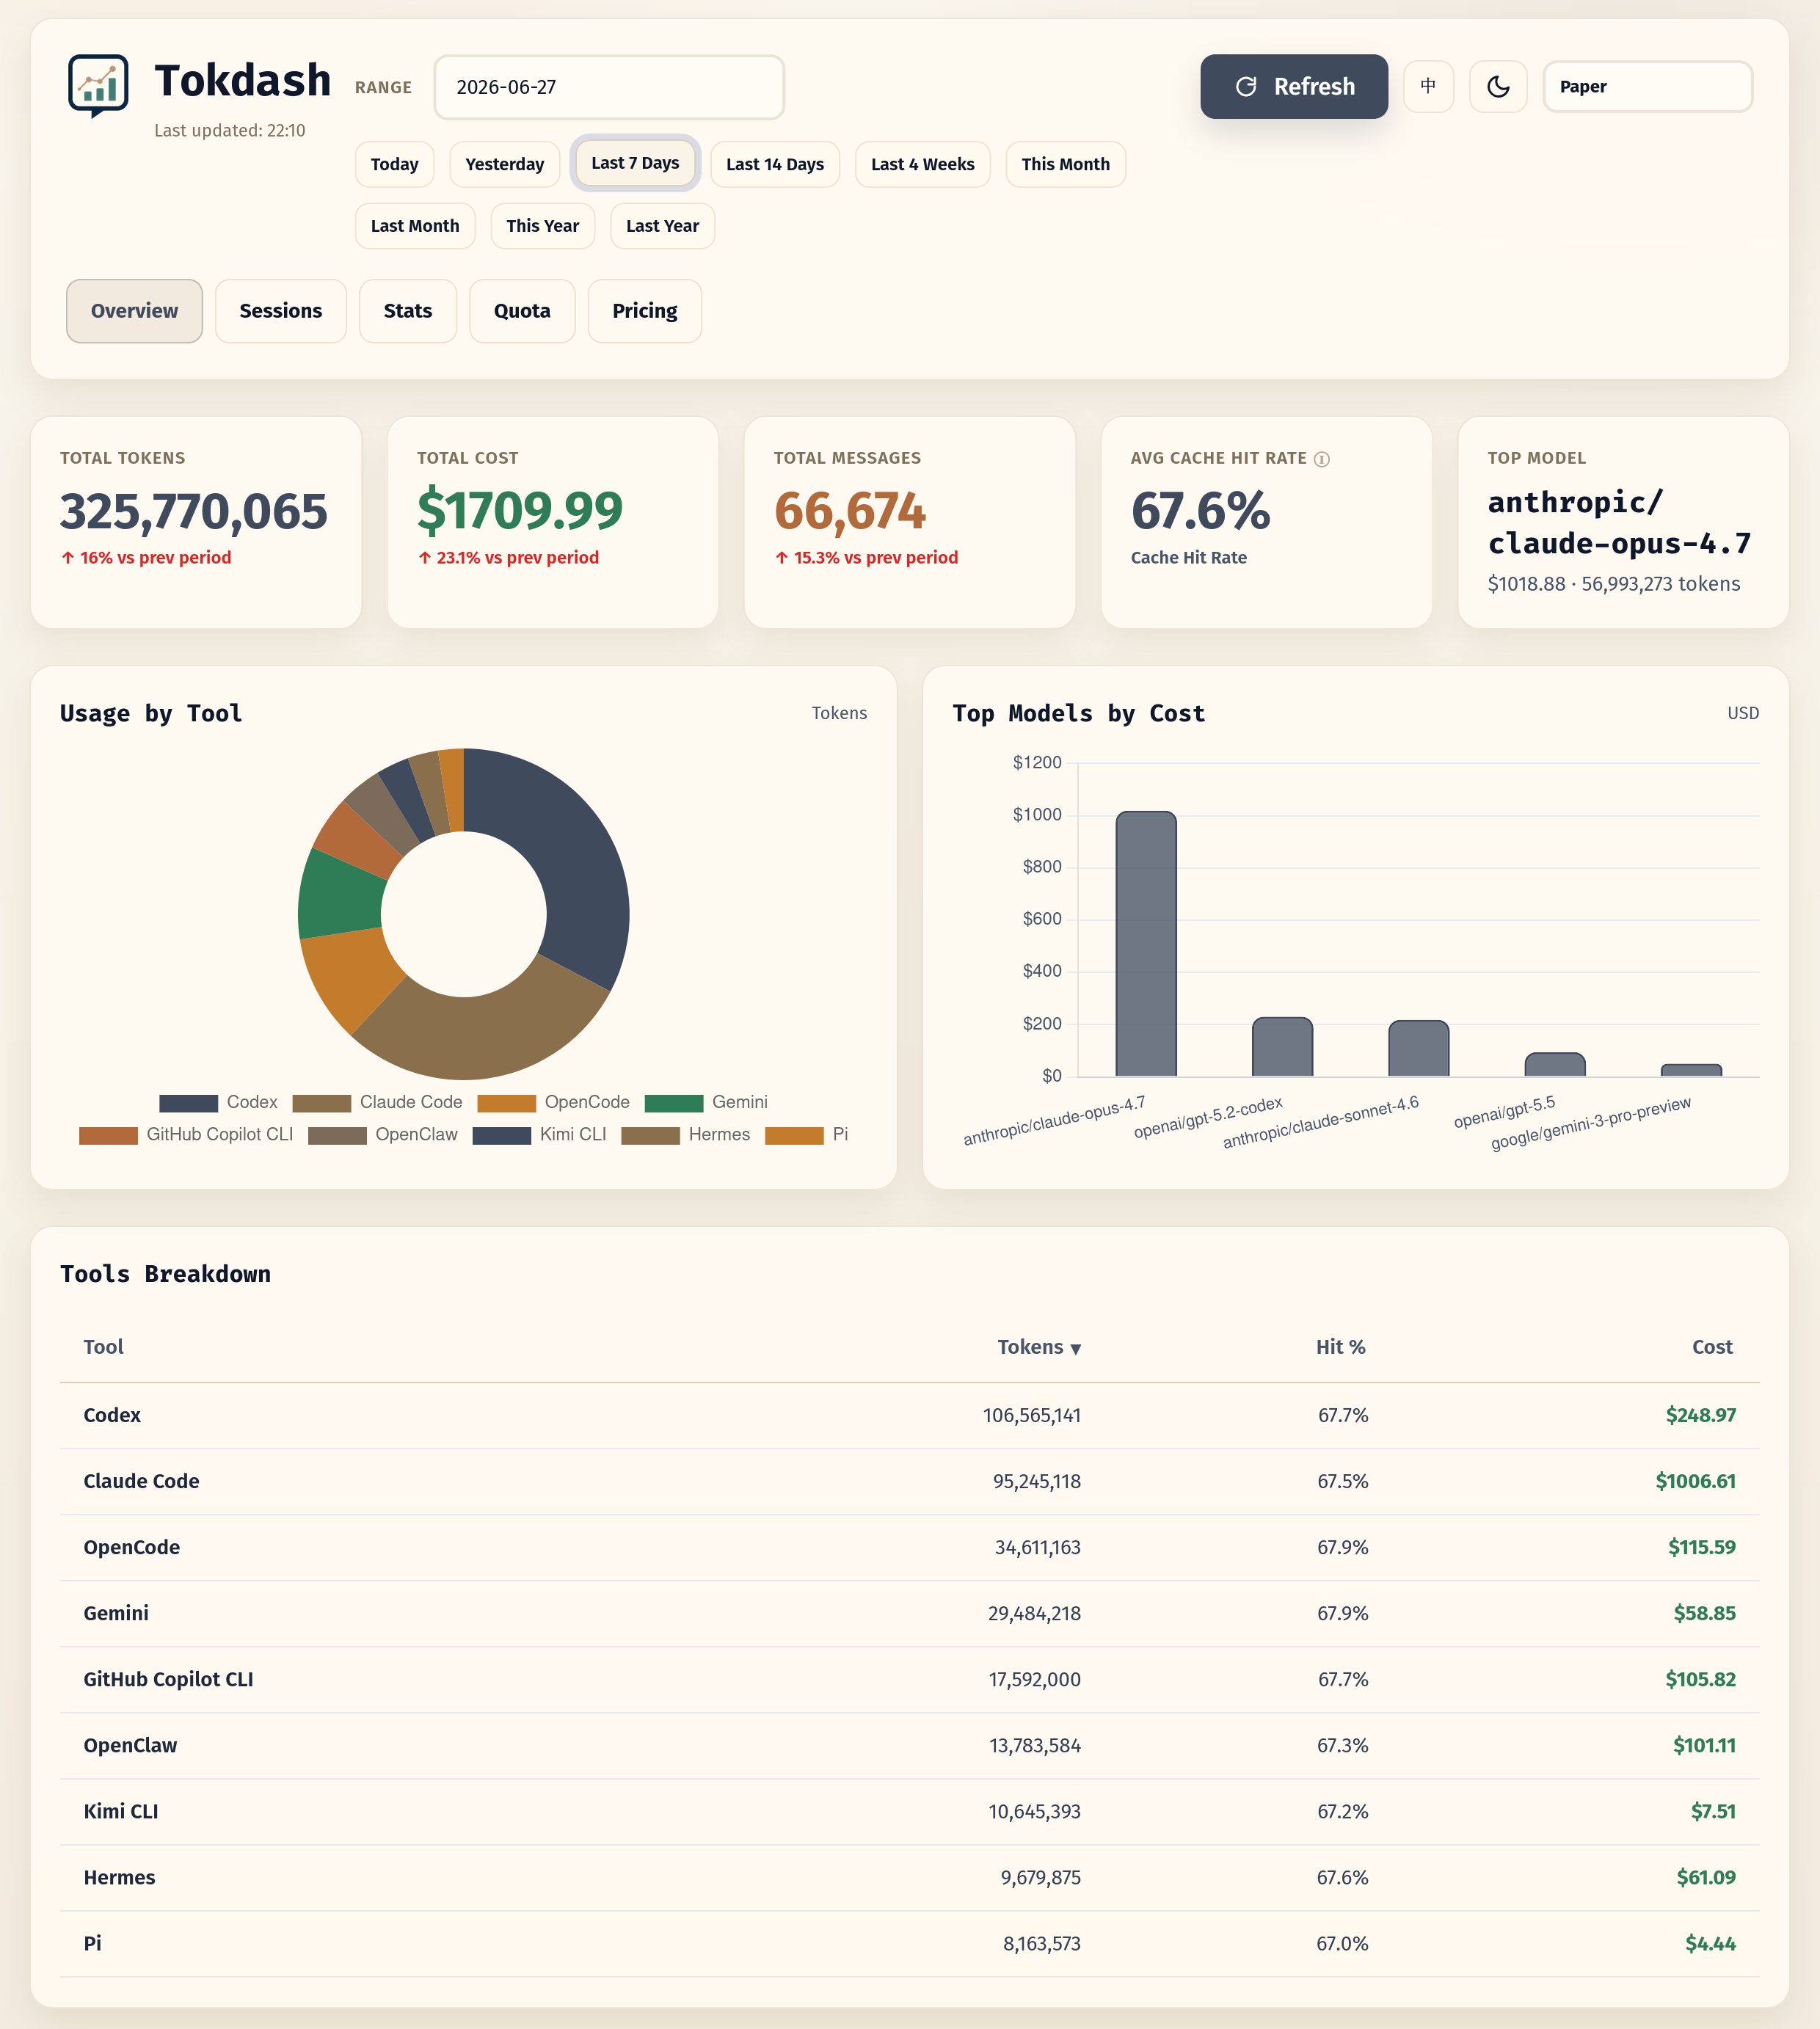
Overview
Sessions
Monthly usage heatmap
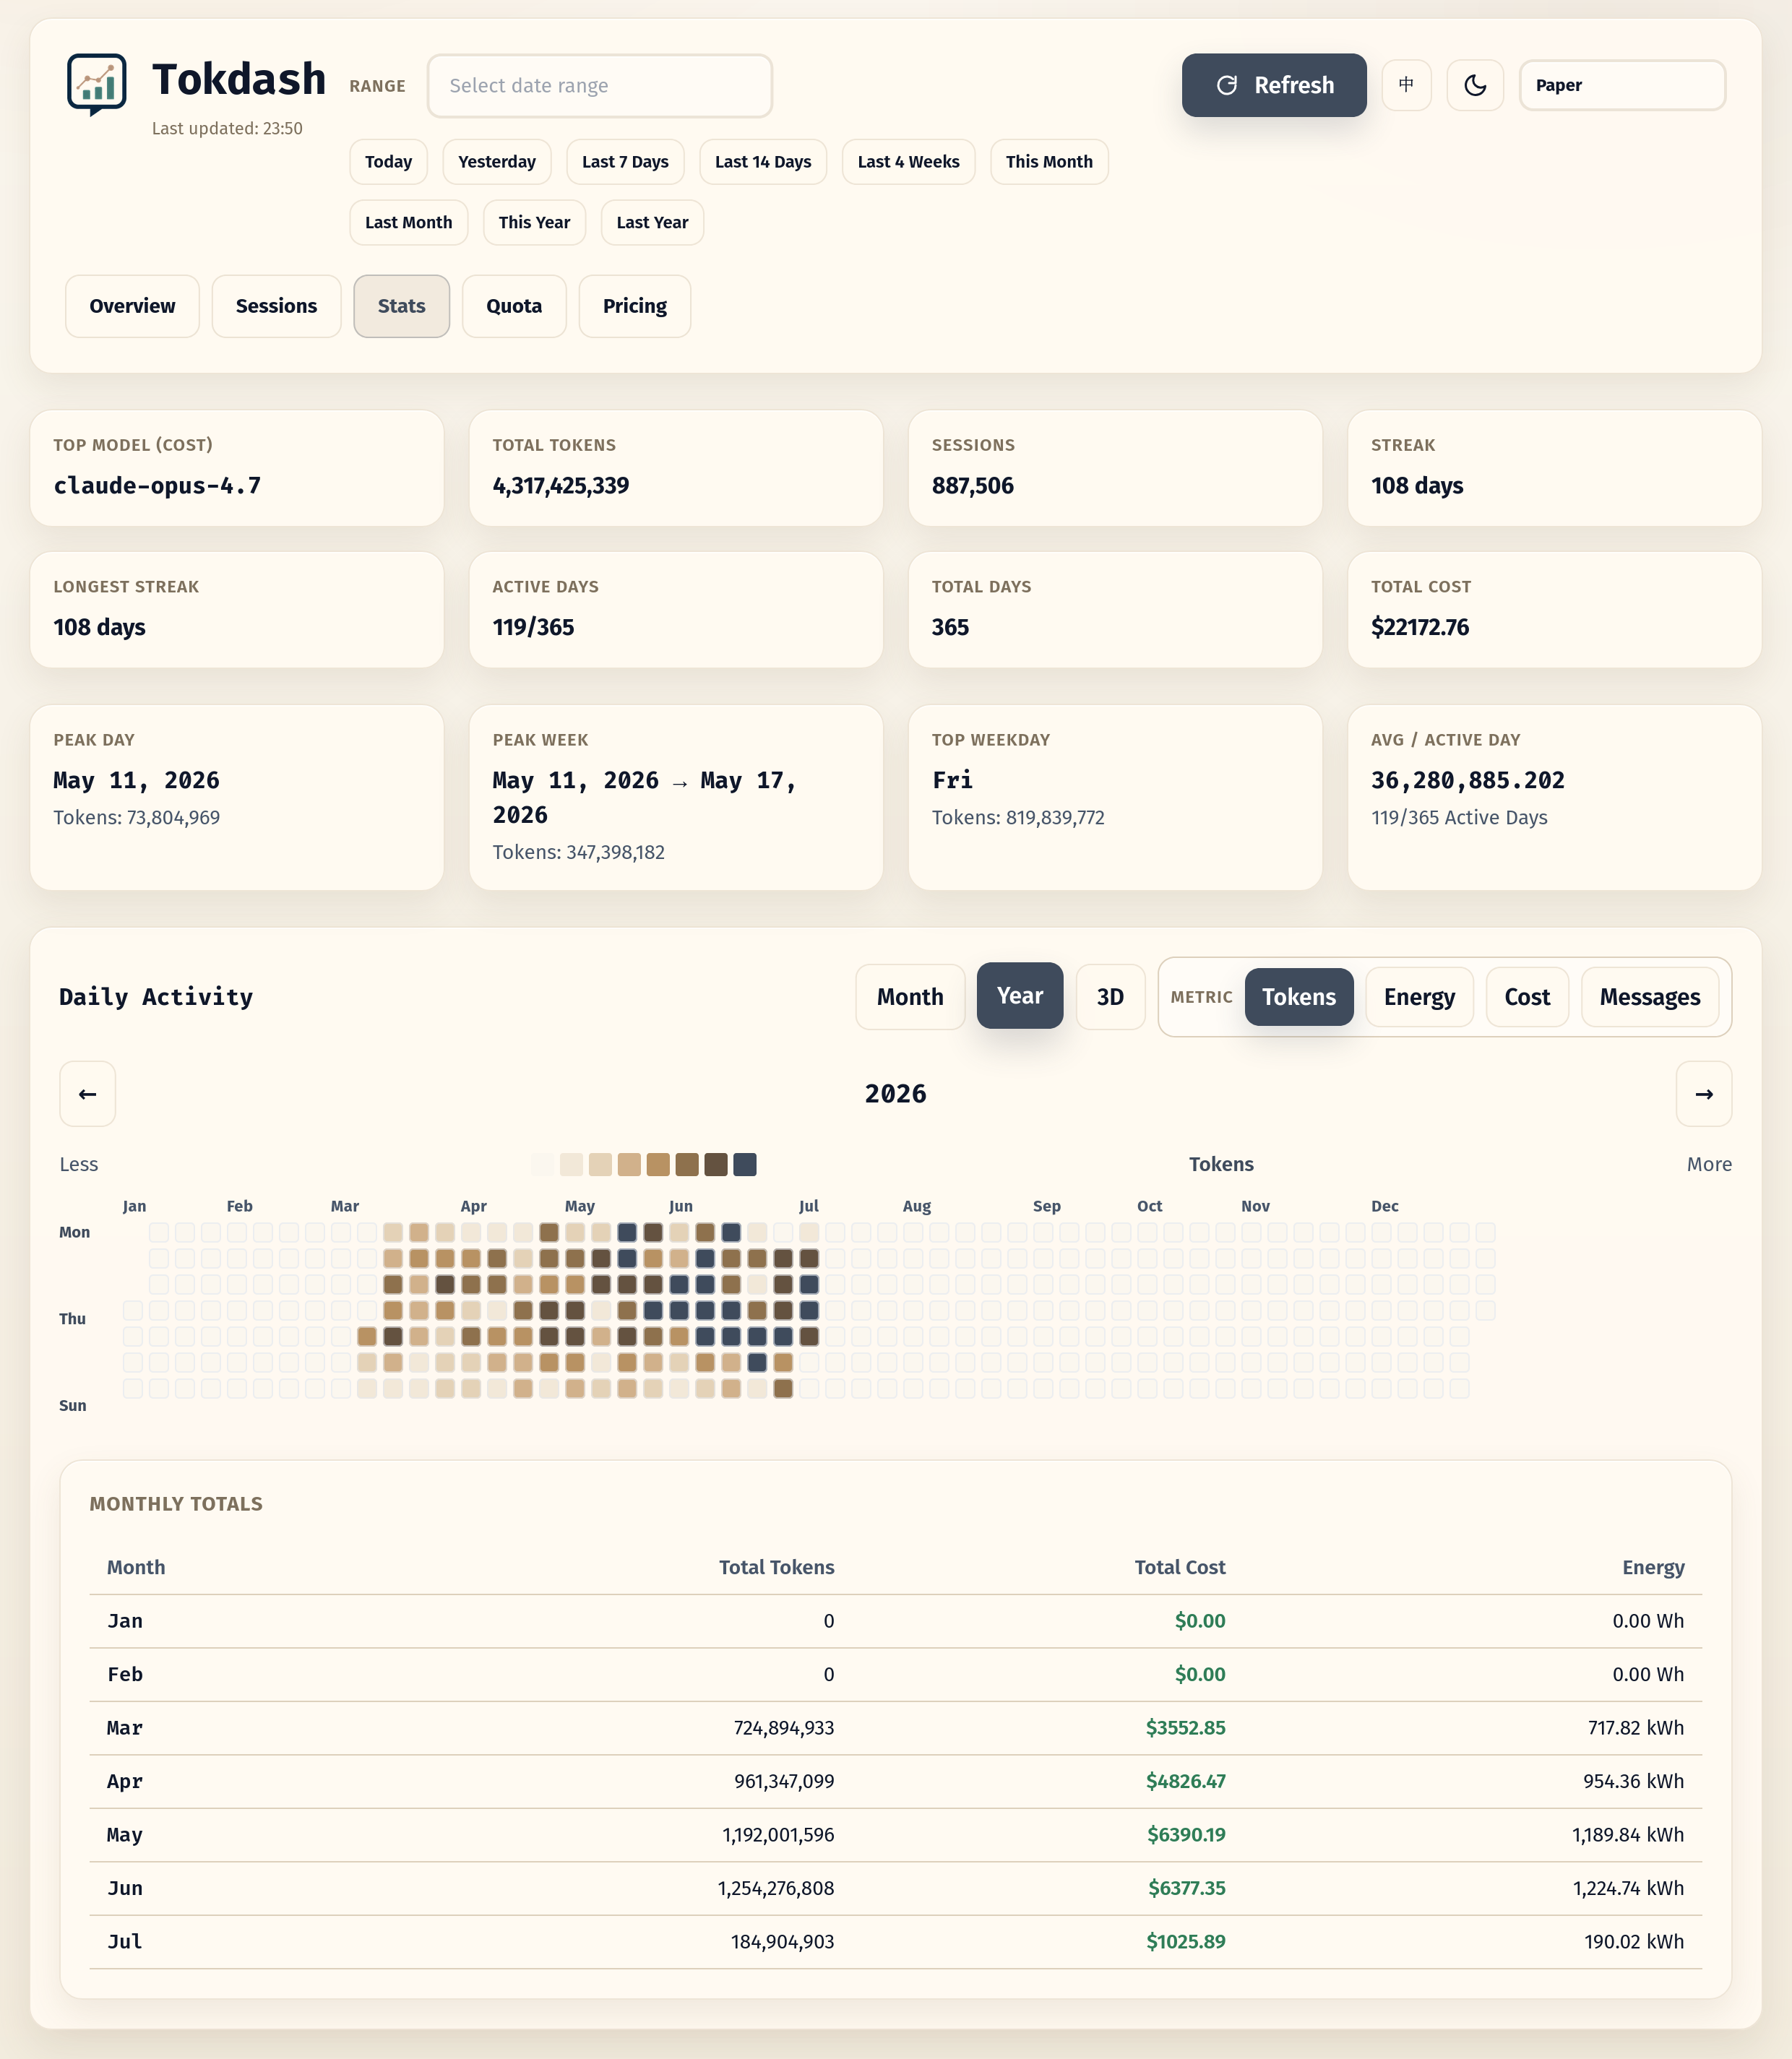
Yearly usage heatmap
Quota tracking
Codex quota and reset credits
Tokdash Companion Status Bar App
The Tokdash Companion Status Bar App is an optional native menu-bar app for
macOS and notification-area app for Windows. It provides a compact, read-only
view of the Tokdash service without keeping the full dashboard open.


macOS menu bar Windows notification area
- Today's cost, tokens, messages, and month-to-date usage
- Combined totals and server-grouped quota from multiple Tokdash endpoints
- Codex, Claude, Kimi, MiniMax, Antigravity, and Grok quota windows
- Relative reset times and optional low-quota notifications
- Optional launch at login
- System, English, and Simplified Chinese display languages
- No telemetry, credential discovery, port scanning, or direct log parsing
Download
Download Tokdash Companion 0.2.0 from GitHub Releases:
| Platform | Download | Requirements |
|---|---|---|
| macOS | Universal DMG (arm64 + x86_64) |
macOS 14 or newer |
| Windows | Self-contained portable ZIP (x64) |
Windows 11; Windows on Arm can use x64 emulation |
[!WARNING]
The current companion binaries are unsigned previews. macOS Gatekeeper
and Windows SmartScreen will show an unknown-publisher warning. Download only
from this repository, verify the includedSHA256SUMS, and continue only if
you trust the release. Signing and notarization are planned for a later
release.
Set up
- Install and start Tokdash 1.5.2 or newer using the Quick start.
- Download the asset for your platform and verify it against
SHA256SUMS. - On macOS, open the DMG and drag
TokdashCompanionto Applications. On
Windows, extract the ZIP to a stable directory and runTokdashCompanion.exe. - The companion connects to
http://127.0.0.1:55423by default. Open its
settings to add, test, name, enable, or remove explicit Tokdash endpoints,
including private Tailscale Serve URLs.
The companion only contacts the Tokdash endpoints you configure. Low-quota
notifications and launch at login are both opt-in and disabled by default.
See the companion release guide for checksum,
update, and removal instructions.
Quick start
Platform support
- Linux (including WSL2): supported
- macOS: supported
- Windows (native): experimental
Prerequisites
- Python 3.10+
- One or more supported clients installed
Install
Recommended isolated install:
pipx install tokdash
If you do not use pipx:
python3 -m pip install --user tokdash
First run
Run the onboarding wizard:
tokdash setup
The wizard configures a reversible user-level background service when the platform supports
one, then prints the dashboard URL (default: http://127.0.0.1:55423). If no supported
service manager is available, it records setup state and prints foreground run guidance. It
uses localhost-first defaults, does not require sudo for the local service, and keeps your
usage history unless you later uninstall with --purge.
To expose the dashboard explicitly on all network interfaces with writes disabled, runtokdash setup --bind 0.0.0.0; review the remote-access guide first.
For a non-interactive setup from an agent, script, or bundle:
tokdash setup --auto --json
To preview what setup would change:
tokdash setup --dry-run
Verify
tokdash doctor
doctor checks the runtime, background service, configured port, data paths, and update-check
status. Use tokdash doctor --json for automation.
Update or remove
tokdash update       # upgrade the managed runtime and restart the service when possible
tokdash uninstall    # reverse exactly what setup created; keeps usage history by default
update only drives install methods Tokdash can safely manage. If your runtime was installed
by a package manager Tokdash does not own, it prints the exact manual guidance instead of
mutating that environment. For managed runtimes, update reports the Tokdash version before
and after the upgrade; if the version is unchanged, it says Tokdash is already at that version
instead of implying a new package was installed.
Existing installs: migration from before v1.0
If you installed Tokdash before the onboarding flow, upgrade first:
pipx upgrade tokdash
# or: python3 -m pip install --user -U tokdash
Then run tokdash doctor and tokdash setup when you want Tokdash to manage the background
service. If you already have a hand-written systemd or launchd service, setup does not
silently replace it: it refuses unmarked tokdash.service / plist files by default. Keep
managing that service yourself, remove it before setup, or run tokdash setup --force after
checking tokdash setup --dry-run. --force also handles pre-1.0 services that already
occupy port 55423 but do not expose the new /health fingerprint: it rewrites and restarts
the existing tokdash.service. Use tokdash setup --no-service to skip service creation.
If your current setup uses a conda/system/user-pip interpreter and you want tokdash update
to manage future upgrades, migrate the service to Tokdash's setup-owned venv:
# Upgrade the tokdash command you are about to run, for example:
python3 -m pip install --user -U tokdash
# or, for a conda base install:
conda run -n base python -m pip install -U tokdash
tokdash setup --runtime venv --force
tokdash doctor
This keeps your usage history under ~/.tokdash, rewrites the user service to run~/.tokdash/runtime/python-venv/bin/python -m tokdash, and lets future tokdash update
upgrade that managed venv and restart the service. If you installed with pipx, you can
instead keep the pipx runtime and upgrade with tokdash update or pipx upgrade tokdash.
Remote access
Tokdash stays loopback-bound by default. Interactive tokdash setup can configure Tailscale
Serve after explicit confirmation, providing private HTTPS read access from Windows or another
tailnet device. Use SSH forwarding when you need authenticated write access. An explicit--bind 0.0.0.0 provides read-only network access but exposes the unauthenticated dashboard on
every reachable interface.
See docs/guides/REMOTE_ACCESS.md for setup commands, WSL2 guidance,
access URLs, write behavior, and security trade-offs.
Foreground fallback
If you only want a one-off foreground process:
tokdash serve
Open http://127.0.0.1:55423. Use tokdash serve --port <port> if the default port is busy.
For full onboarding details, including runtime choices, WSL/systemd behavior, macOS launchd,
Tailscale, bundling, update checks, and safe uninstall semantics, seedocs/guides/ONBOARDING.md.
OpenClaw digest (scheduled reports)
Tokdash can power daily/weekly/monthly OpenClaw usage reports by querying the local API on a schedule.
For Humans
Copy and paste this prompt to your LLM agent (Claude Code, AmpCode, Cursor, etc.):
Install and configure scheduled Tokdash usage reports for OpenClaw by following the instructions here:
https://raw.githubusercontent.com/JingbiaoMei/Tokdash/main/docs/guides/agents/openclaw_reporting/AGENTS.md

Or read the guide yourself, but seriously, let an agent do it.
For LLM Agents
Fetch the installation guide and follow it:
curl -s https://raw.githubusercontent.com/JingbiaoMei/Tokdash/main/docs/guides/agents/openclaw_reporting/AGENTS.md
Statusline integration
The local API can power a statusline item in your coding agent (Claude Code, etc.) showing live token/cost stats.
Ready-made templates live in docs/guides/statusline/ — copy one into ~/.claude/scripts/ and add the statusLine block to ~/.claude/settings.json:
statusline-minimal.sh→ one line:[Claude Sonnet 4.6] 📁 myproject | 📊 12.3M ($4.56) todaystatusline-full.sh→ a four-row dashboard with today + week totals and a top-3 per-tool breakdownstatusline.ps1→ the same one-line output as the minimal template, for Claude Code running natively on Windows (PowerShell, nocurl/jqneeded)
All are read-only, localhost-only, and fail silently if Tokdash isn't running. See the folder README for install/config and docs/reference/API.md for the endpoint reference.
Prefer to roll your own? Hand your agent this prompt and point it at docs/reference/API.md:
"I would like to add a statusline item from the tokdash endpoint's API; it should show the total tokens used today."

Configuration
Tokdash is localhost-only by default.
TOKDASH_HOST(default:127.0.0.1)TOKDASH_PORT(default:55423)TOKDASH_CACHE_TTL(default:600seconds)TOKDASH_CACHE_MAX_ENTRIES(default:256) — bound cached API responses and their idle per-key locksTOKDASH_COMPUTE_CONCURRENCY(default:2) — cap on simultaneous heavy history reparses; excess cold requests return a fast503instead of saturating the server under loadTOKDASH_LIMIT_CONCURRENCY(default:64) — uvicorn connection cap (backpressure)TOKDASH_KEEPALIVE(default:5seconds) — uvicorn keep-alive timeoutTOKDASH_ALLOW_ORIGINS(comma-separated, default: empty)TOKDASH_ALLOW_ORIGIN_REGEX(default CORS policy allows localhost/127.0.0.1 and same-tailnet Tailscale Serve reads; setting either CORS option replaces that default policy)TOKDASH_NO_RETENTION_NOTICE(set to1to silence the history-retention reminder printed ontokdash serve)
Session active time (estimated):
Every session reports active_ms alongside span_ms. Span is first-to-last event; active time subtracts idle by counting each gap between consecutive token events only up to an idle cap, so a session left open overnight no longer reads as a 14-hour session.
It is an estimate, and the API says so: summary.active_time_estimated is true and summary.active_time_method is capped-inter-event-gap. The limits follow from the method — a short pause between events is indistinguishable from work, a single operation longer than the cap is truncated to it, and a session with one token event measures zero because nothing precedes it.
Concurrent work is counted two ways. active_ms is clock time, with overlap counted once; active_ms_sum adds the overlap up, i.e. agent time. Both appear per session and per tool in summary. Kimi agents and Claude subagents run alongside the main agent, and each is timed as its own stream: a subagent working one minute in parallel adds a minute of agent time and none of clock time.
TOKDASH_ACTIVE_GAP_CAP_SECONDS(default:300) — idle cap in seconds; gaps longer than this contribute only the cap. Clamped to 1s–6h.
Persistent usage DB (default on):
Tokdash maintains a local SQLite index at ~/.tokdash/usage.sqlite3 by default. It stores parsed token rows and Codex/Claude/Kimi/DeepSeek Harness session summaries so repeated dashboard and API reads can use indexed SQL instead of reparsing every source log. Source logs remain the source of truth; the DB is a local performance index, and Tokdash falls back to live parsing if it is disabled or unavailable.
Cached session rows are price-neutral: they hold each turn's billing inputs (model, fresh input, cache reads and writes, output), and cost is calculated when they are read, with whatever pricing that process has loaded. Editing a rate therefore reprices instantly instead of rereading gigabytes of logs, and two Tokdash versions sharing one database — an installed service and a checkout, say — do not invalidate each other's rows over pricing. Parser and source-file changes still reparse normally. Rows written before this (including any kept by TOKDASH_USAGE_DB_DURABLE after their log is gone) reprice from their stored totals, which reproduces the same figure but cannot separate a Claude or Kimi cache write from fresh input; only a reparse of those logs can restore that distinction. Codex bills under provider/model and stores the bare name, so its older rows are reparsed once instead of reused.
TOKDASH_USAGE_DB(default:1) — set to0,false,no, oroffto disable the persistent usage DBTOKDASH_DATA_DIR(default:~/.tokdash) — base directory for Tokdash local stateTOKDASH_USAGE_DB_PATH(default:$TOKDASH_DATA_DIR/usage.sqlite3) — explicit SQLite file pathTOKDASH_USAGE_DB_DURABLE(default:1) — keep already indexed rows if a source file temporarily disappears or a parser returns no rows; set to0for strict source replacementTOKDASH_USAGE_DB_WATCH(default:0) — set to1to run a background sync loop insidetokdash serveTOKDASH_USAGE_DB_WATCH_INTERVAL(default:30seconds) — sync interval fortokdash db watchand the serve-time watch loop
DB maintenance commands:
tokdash db status --pretty
tokdash db sync --pretty
tokdash db verify --verify-period today --pretty
tokdash db repair --dry-run --pretty
tokdash db resync --pretty
tokdash db watch --pretty
For remote access through Tailscale Serve, SSH forwarding, or an explicit network bind, seedocs/guides/REMOTE_ACCESS.md. Interactive tokdash setup can configure and
record the Tailscale Serve rule after you opt in.
By default tokdash serve opens the dashboard in your browser once on startup. Pass --no-open to disable this (it is also skipped automatically in headless/SSH environments and in the background service templates).
Privacy & security
- No telemetry: Tokdash does not intentionally send your data anywhere.
- Local parsing: usage is computed from local session files (see supported clients).
- Optional quota polling: the Quota tab is local-only by default. Per-provider API polling can be enabled from the tab or with
tokdash quota consent; it uses your local CLI credentials only to call that provider's own quota endpoint, and stores responses in the local usage SQLite DB. - Server exposure: Tokdash binds to
127.0.0.1by default. Tailscale Serve provides private read-only access, SSH forwarding provides authenticated write access, and--bind 0.0.0.0explicitly exposes unauthenticated reads on every interface. See the remote-access guide.
Quota tracking (optional)
The Quota tab shows subscription utilization windows and reset timers, from two data sources. Local logs (no network): Codex records its own quota in session files, so the Codex 5-hour/weekly windows work out of the box — but they update only when you use Codex, and the logs never contain reset credits or metered-feature windows. Treat session-log Codex consumption as an **est